Modelling
Hydrothermics
Investigation of the long-term hydrothermal reservoir behaviour is performed by numerical simulation. The simulation is based on models which allow for the reservoir geometry after hydraulic stimulation. Thereby, stimulation-induced large-scale fractures are an essential part of the models. The numerical simulations are calibrated by comparison with short-term hydraulic and thermal observations during in-situ tests.
By means of numerical model calculations the capability of the concept for producing energy over a common life expectancy (generally 20 – 25 years) can be verified. In particular two different cyclic schemes, the weekly and annual cyclic schemes are analysed with the same model.
Using the weekly cyclic scheme during a period of 36 hours into the artificial fracture cold water is injected. After a waiting period of 30 hours in 5 daily intervals 16 hours heated water is produced and subsequently waited 8 hours.
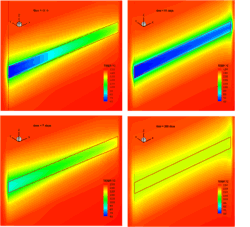
 Figure 1: Spatial temperature distribution after 4 years of operation. Left column: weekly cyclic scheme. Right column: annual cyclic scheme. Upper row shut in time. Lower row end of production cycle (2 layers, fracture length x/2 = 1000 m, exaggeration of z-axis = 15)
By means of annual weekly scheme during three months in spring and summer, 200.000 m³ of cold water are injected into the Detfurth sandstone. Following a heating-up period of three months hot water is produced for use during the cold season. In contrast to the weekly based scheme heat is supplied also at night and at week ends.
The upper two figures show the spatial temperature distribution at the end of an injection phase at shut in time. For both schemes the major part of the heat is extracted from the almost impermeable clay stone layers, which embed the permeable Detfurth sand stone. It can bee seen, that the annual scheme uses the artificial fracture thermal more efficient.
Figure 2 shows the mean computed power output for the heating periods for multiple fracture systems for the weekly and annual cyclic schemes. As was expected from the higher temperatures the thermal power output, is essentially higher for the annual cyclic scheme.
A comparison of 4 layer heat exchangers with 2 layer heat exchangers show, that given the same total fracture area, the power output increases with the number of fractures.
Our numerical investigations indicate that one-well geothermal systems operated in an annual or weekly cyclic mode are able to supply thermal power in a range of some MW for several decades.
Geothermal energy production by cyclic loading and de-loading of hydraulically induced fractures in low permeable rock is a promising method for space heating for consumers of medium size (like hospitals, building complexes etc. like it is the Geozentrum of Hannover).
 Figure 2: Mean thermal power output during heating periods using annual and weekly cyclic schemes for multiple fracture systems, fracture length x/2 = 1000 m
Hydromechanics
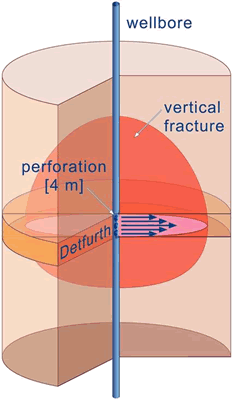
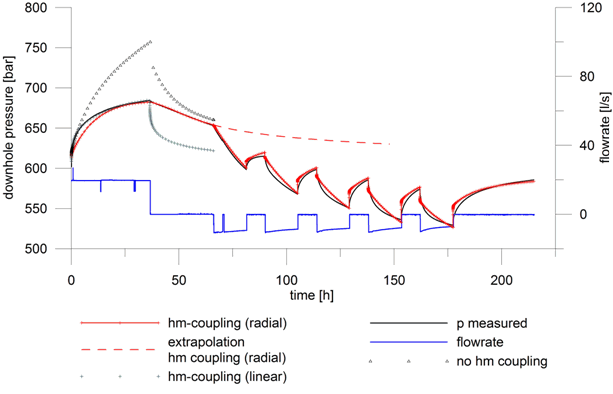
In particular, hydromechanical behaviour of the geothermal reservoir needs to be considered in artificially created fractures (Fig. 3). Due to the created fluid overpressure by water injection with high flow rates, a large-scale hydraulic fracture opens that represents a large area for the exchange of thermal energy. Meanwhile, in-situ tests show that the fracture closes after the pressure has been released from the fracture. Numerical simulations confirm such kind of hydromechanical fracture behaviour (Fig. 4), hence such simulations help to predict the reservoir behaviour during energy recovery.
 Figure 3: Schematic visualization of the hydromechanical processes and their coupling mechanisms
The figure below shows possible flow regimes which likely prevail before and after the opening of a large-scale fracture.
 Figure 4: Schematic illustration of the flow regimes at low (left)
 Figure 4: Schematic illustration of the flow regimes at high (right) injection rate, due to hydromechanical fracture opening.
 Figure 5: Simulation results from FE calculations performed with ROCMAS. Simulation with hydromechanical fracture behaviour enables a good fit of the injection and shut-in phase.


